
What Does the Dashboard Offer You?
The Insights Dashboard is your central control center for monitoring sustainability performance across all sites. It provides a comprehensive overview of recycling rates, CO₂ emissions, cost developments, and site rankings to support data-driven decisions for environmental and financial optimization.
What Are the Benefits?
-
Identify weaknesses and areas for improvement in waste management
-
Make fact-based decisions (e.g. about recycling strategies or supplier selection)
-
Analyze and optimize costs
-
Make sustainability goals measurable and document progress
-
Simplify communication with internal stakeholders (e.g. management, compliance)
How to Work with the Dashboard
Filter Data
Use the comprehensive filter panel to adjust your view by time period, specific locations, waste management partners, material categories, or individual materials. This allows you to focus on specific aspects of your operations.
Interactive Charts
Click on data points in the charts to view detailed information. Use drill-downs to break down specific data points by dimensions like materials, sites, or waste contractors, enabling direct comparisons.
Performance Monitoring
Monitor trends over time and compare current performance with historical data to identify improvements or areas that require attention.
Explanation of Metrics and KPIs
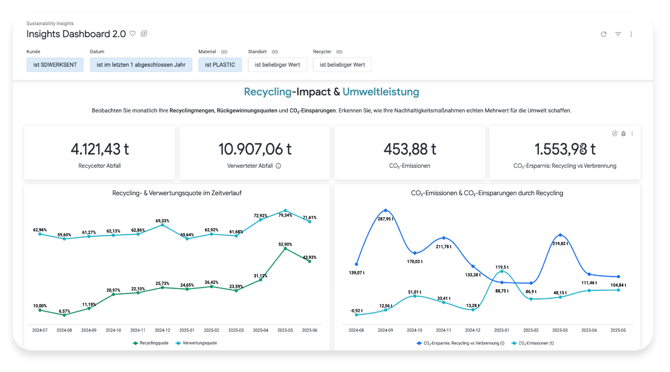
Recycling & Recovery Performance Chart
Recycling Impact & Sustainability Metrics
-
Recycling Rate
The percentage of total waste that is materially recycled. -
Recovery Rate
The efficiency of material recovery from waste streams. It indicates the total amount of waste that is either materially recycled or energetically recovered (e.g., via incineration with energy generation).
A high recovery rate shows that most waste is reused or used for energy production instead of being landfilled.
CO₂ Emissions Chart
-
Total Emissions
Overall CO₂ footprint from waste management activities, including transport and processing, over time. Reflects the actual environmental impact on a monthly basis. -
Emissions Saved
CO₂ reduction achieved through recycling, in comparison to disposal methods like incineration. Enables you to compare your CO₂ emissions and understand how much was saved through recycling.
Disposal Rates – Performance Chart

-
Recycling Rate
The percentage of total waste that is materially recycled. -
Incineration Rate with Energy Recovery
The percentage of total waste that is thermally treated with energy recovery (disposal code R1). -
Incineration Rate
The percentage of total waste that is incinerated without energy recovery. -
Landfill Rate
The percentage of total waste that is landfilled.
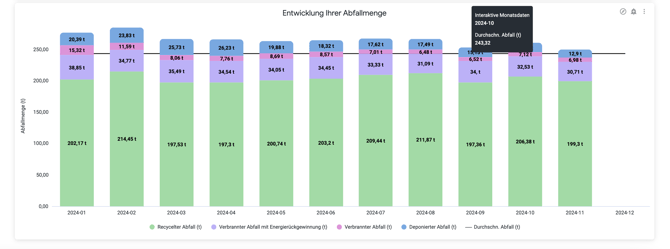
Volumes Overview – Chart
-
Overall Waste Volume Trends
Total waste generated within a selected time period. Includes all quantities from recycling, recovery, incineration, and landfill.A drill-down to analyze the distribution of volumes by material, site, and contractor is possible.
Cost Overview – Performance Chart

-
Total Costs
Full financial expenditure for waste management, including collection, processing, and disposal. -
Average Waste Costs
Average costs for overall waste management. Enables comparisons between monthly costs and the average costs for the selected period.

Cost per Ton – Chart
Cost per Ton
A unit cost-efficiency metric to compare performance across sites and time periods.
Cost Breakdown
Distribution of costs across various disposal methods (recycling, incineration, landfill).

Benchmarking – Site Performance Ranking
-
Site Performance Ranking
Relative performance positioning compared to other sites, enabling benchmarking of recycling rates, CO₂ efficiency, and cost performance.